4.17. SMITER-PFCFLUX ‘Faraday screen bars misalignment’
4.17.1. Introduction
This study examines the different cases of misalignments of Faraday screen bars. First, the screen bars with highest power deposition are located and then they are displaced by \(1mm\) and \(2mm\) to study the increase in wetted area and power deposition. This case is the repetition of a similar study done in PFCFLUX in ITER IDM document “Design Plasma Heat Load on the Iter Faraday Screen of the ICRH Antenna” with ID Q3LWNM.
Surfaces of Faraday screen that can be reached by the plasma are shown in Fig. 4.52:
- Beryllium (Be) front face
- Beryllium layer
- Copper (Cu) layer
- Copper-chromium-zirconium (CuCrZr) layer
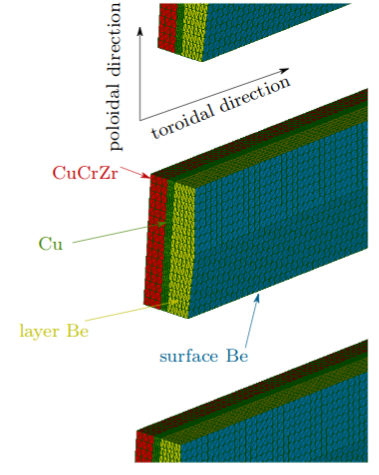
Fig. 4.52 Toroidal and poloidal layers of Faraday screen.
4.17.2. Input data
4.17.2.1. Equilibrium
The equilibrium used is EQDSK-G Limiter_7.5MA_outbord.EQDSK with the following specifications:
- Plasma current: \(I= 7.5MA\)
- Nominal toroidal magnetic field: \(B_T = 2.65T\) at \(R= 6.2m\).
- Magnetic pitch: \(B_{\theta}/B_{\Phi}= 0.154\)
The contour plot of magnetic flux (\(\psi\)) values with LCFS and LIMITER wall for the equilibrium file used is shown in Fig. 4.53.
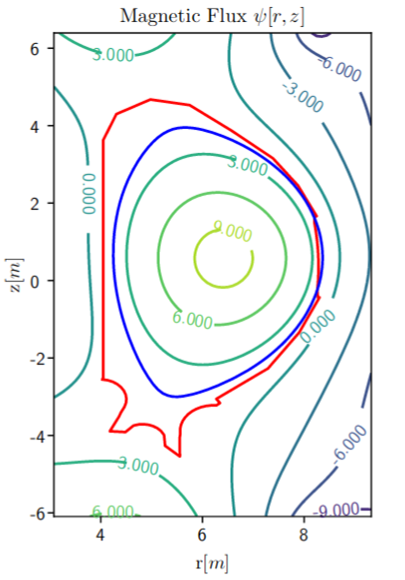
Fig. 4.53 The contour plot of magnetic flux (\(\psi\)) values with LCFS and LIMITER wall.
4.17.3. Cases description
Open the ITER_IDM_Q3LWNM_misalignment case and navigate to Object
Browser. SMITER cases there can be divided into two categories:
- Cases with “full bar” target (all four layer are included into
target: Be front face, Be layer, Cu layer and CuCrZr layer):
- nominal_position (all bars are at nominal position)
- bar7_misalignment_1mm: Misaligment of bar 7 towards the plasma for \(1mm\).
- bar7_misalignment_2mm: Misaligment of bar 7 towards the plasma for \(2mm\).
- bar8_misalignment_1mm: Misaligment of bar 8 towards the plasma for \(1mm\).
- bar8_misalignment_2mm: Misaligment of bar 8 towards the plasma for \(2mm\).
- bar9_misalignment_1mm: Misaligment of bar 9 towards the plasma for \(1mm\).
- bar9_misalignment_2mm: Misaligment of bar 9 towards the plasma for \(2mm\).
- bar10_misalignment_1mm: Misaligment of bar 10 towards the plasma for \(1mm\).
- bar10_misalignment_2mm: Misaligment of bar 10 towards the plasma for \(2mm\).
- Cases with “front layer only” target (only Be front face)
- nominal_position_front_face (all bars are at nominal position)
- bar7_misalignment_1mm_front_face: Misaligment of bar 7 towards the plasma for \(1mm\).
- bar7_misalignment_2mm_front_face: Misaligment of bar 7 towards the plasma for \(2mm\).
- bar8_misalignment_1mm_front_face: Misaligment of bar 8 towards the plasma for \(1mm\).
- bar8_misalignment_2mm_front_face: Misaligment of bar 8 towards the plasma for \(2mm\).
- bar9_misalignment_1mm_front_face: Misaligment of bar 9 towards the plasma for \(1mm\).
- bar9_misalignment_2mm_front_face: Misaligment of bar 9 towards the plasma for \(2mm\).
- bar10_misalignment_1mm_front_face: Misaligment of bar 10 towards the plasma for \(1mm\).
- bar10_misalignment_2mm_front_face: Misaligment of bar 10 towards the plasma for \(2mm\).
4.17.3.1. GEQO parameters
Under beqparameters one can observe following parameters
| Parameter | Value | Description |
|---|---|---|
| beq_bdryopt | 15 | \(\psi_m=\psi_{ltr}\) Boundary based on nodes of geometry, outboard values are used for \(R_m,B_{pm}\) and \(B_m\) |
| beq_cenopt | 4 | Read the center values of R and Z from eqdsk file |
| beq_fldspec | 1 | Use flux coordinates |
| beq_nzetap | 1 | Fieldlines might go around torus! |
| beq_fscale | 2 | Equilibrium I is scaled by this quantity |
| equil_scale | .true. | Must be set to .true. in order to enable beq_fscale |
Note
Parameter beq_fscale was set to 2, because in the PFCFLUX study, equilibrium was scaled by the factor of 2 as well.
4.17.3.2. HDSGEN parameters
Refer to general setting parameters for limiter cases for HDSGEN .
4.17.3.3. POWCAL parameters
Besides standard POWCAL parameters (refer to )
| Parameter | Value | Description |
|---|---|---|
| calculation_type | local | ‘local’ shadowing only by toroidally localised geometry |
| shadow_control | 1 | Enable shadowing |
| q_parallel0 | 29000000 | Parallel heat flux at outer midplane (in \(W/m^2\)) |
| power_split | 1 | power split ion to electron direction. |
| decay_length | 0.024 | decay length in meters. |
4.17.4. Results
Peak heat flux on front face \(q= 0.477MW/m^2\) appears in the upper left quadrant on bar nr. 9 (counted from top to bottom, see Fig. 4.55). If toroidal and poloidal layers are included into target mesh, the peak power deposition appears in upper left quadrant on bar nr. 10, where the peak heat flux is \(q= 1.966MW/m^2\).
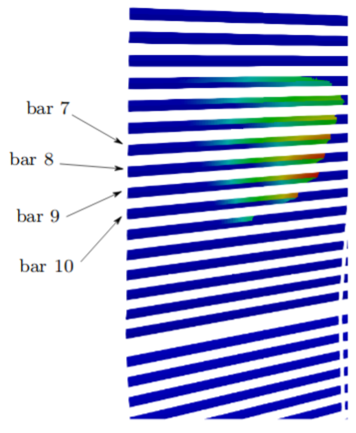
Fig. 4.55 Location of bars 7, 8, 9 and 10 in the upper left quadrant of Faraday screen.
4.17.4.1. 1 mm misalignment
One can see that the bars with maximum thermal loading are located in the upper left quadrant (bars 7, 8, 9,10), as shown in Fig. 4.55. These 4 most loaded bars wereadvanced individually by \(1mm\) in order to take into an account the possible misalignment of bars. The heat flux deposition is done for 4 cases:
- 1 mm Bar 7: Bar nr. 7 is advanced by \(1mm\).
- 1 mm Bar 8: Bar nr. 8 is advanced by \(1mm\)
- 1 mm Bar 9: Bar nr. 9 is advanced by \(1mm\).
- 1 mm Bar 10: Bar nr. 10 is advanced by \(1mm\)
In each configuration, only one bar is advanced by \(1mm\) while the others remain at nominal position andthe power deposition is then computed. The peaks for individual configurations are shown in tables below:
| Peak heat load on bar[\(MW/m^2\) ] | no misalignment | 1 mm on bar 7 | 1 mm on bar 8 | 1 mm on bar 9 | 1 mm on bar 10 |
|---|---|---|---|---|---|
| bar 7 | 1.346 | 1.403 | 1.343 | 1.347 | 1.343 |
| bar 8 | 1.601 | 1.595 | 1.666 | 1.608 | 1.608 |
| bar 9 | 1.813 | 1.817 | 1.820 | 1.893 | 1.813 |
| bar 10 | 1.965 | 1.965 | 1.967 | 1.967 | 2.047 |
| increase[%] | 4.2 | 4.0 | 4.4 | 4.2 |
| Peak heat load on bar[\(MW/m2\) ] | no misalignment | 1 mm on bar 7 | 1 mm on bar 8 | 1 mm on bar 9 | 1 mm on bar 10 |
|---|---|---|---|---|---|
| bar 7: front face | 0.422 | 0.443 | 0.422 | 0.422 | 0.422 |
| bar 8: front face | 0.461 | 0.461 | 0.487 | 0.460 | 0.461 |
| bar 9: front face | 0.477 | 0.477 | 0.476 | 0.507 | 0.476 |
| bar10: front face | 0.417 | 0.418 | 0.417 | 0.415 | 0.459 |
| increase[%] | 4.9 | 5.6 | 6.2 | 10 |
One can observe that in the case of misalignment of \(1mm\) the maximum power deposition always appears on bar nr. 10. The maximum power deposition is the biggest when the bar nr. 10 is advanced \(1mm\) towards the plasma. Maximum power deposition on front surface is found on bar nr. 9 except when advancing bar nr. 8. If bars stay at nominal position, their maximum power deposition does not change. One can conclude that misaligned bar does not shadow other bars at nominal position, at least not with respect to diminishing the peak power deposition of bars at nominal position.
4.17.4.2. 2 mm misalignment
Further on, the bars are advanced by additional \(1mm\) up to \(2mm\) altogether. In each configuration, only one bar is advanced by \(2mm\) while the others remain at nominal position. The power deposition is then computed. The heat flux deposition is done for 4 cases: * 2 mm Bar 7: Bar nr. 7 is advanced by \(2mm\). * 2 mm Bar 8: Bar nr. 8 is advanced by \(2mm\). * 2 mm Bar 9: Bar nr. 9 is advanced by \(2mm\). * 2 mm Bar 10: Bar nr. 10 is advanced by \(2mm\).
The peaks for individual configurations are shown in below for target mesh with layers and for front faces only.
| Peak heat load on bar[\(MW/m^2\) ] | no misalignment | 2 mm on bar 7 | 2 mm on bar 8 | 2 mm on bar 9 | 2 mm on bar 10 |
|---|---|---|---|---|---|
| bar 7 | 1.346 | 1.459 | 1.347 | 1.347 | 1.347 |
| bar 8 | 1.601 | 1.605 | 1.726 | 1.607 | 1.608 |
| bar 9 | 1.813 | 1.820 | 1.818 | 1.966 | 1.820 |
| bar 10 | 1.965 | 1.965 | 1.955 | 1.964 | 2.134 |
| increase[%] | 8.4 | 7.8 | 8.4 | 8.6 |
| Peak heat load on bar[\(MW/m^2\) ] | no misalignment | 2 mm on bar 7 | 2 mm on bar 8 | 2 mm on bar 9 | 2 mm on bar 10 |
|---|---|---|---|---|---|
| bar 7: front face | 0.422 | 0.464 | 0.422 | 0.423 | 0.423 |
| bar 8: front face | 0.461 | 0.460 | 0.512 | 0.461 | 0.460 |
| bar 9: front face | 0.477 | 0.477 | 0.477 | 0.536 | 0.477 |
| bar 10: front face | 0.417 | 0.415 | 0.416 | 0.418 | 0.497 |
| increase[%] | 10 | 11 | 12.7 | 19 |
In case of \(2mm\) misalignment one can see that the maximum power deposition again mostly appears on bar nr. 10, except in the bar nr. 9 misalignment configuration. The maximum power deposition is the biggest when the bar nr. 10 is advanced \(2mm\) towards theplasma and exceeds \(2MW/m^2\). Maximum power deposition on front surface is found on bar nr. 9 except when advancing bar nr. 8. The summarization of power deposition on front faces is given in table below.
| Front face maximum heat load [\(MW/m^2\) ] | Average increase [%] | |
|---|---|---|
| Nominal position | 0.477 | |
| 1mm bar misalignment | 0.507 | +6.7 |
| 2mm bar misalignment | 0.536 | +13.2 |
One can observe that the increase in peak heat flux seems to be linear with respect to misalignment distance. The summarization of power deposition on poloidal faces is given in table below.
| Maximum heat load [\(MW/m^2\) ] | Average increase [%] | |
|---|---|---|
| Nominal position | 1.956 | |
| 1mm bar misalignment | 2.047 | +4.2 |
| 2mm bar misalignment | 2.134 | +8.3 |
The wetted are difference for no misalignment and \(2mm\) misalignment of bar 10 is shown in Fig. 4.56.
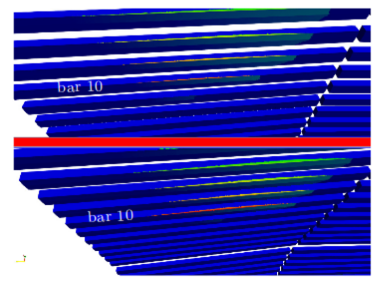
Fig. 4.56 Result with no misalignment (top) and result with \(2mm\) misalignment of bar nr. 10 (bottom). Notice the difference in wetted area in \(r\) direction and toroidal direction. Wetted area in toroidal direction is more elongated if the bar is advanced towards the plasma.